
Genome Sequence Centre Completes a Physical Map of the Mouse Genome
A 17-month project culminates in a physical map of the mouse using 300,000 BACs
Vancouver, BC, Canada | The Genome Sequence Centre has completed a fingerprint-based physical map of the mouse genome. The map was constructed by generating restriction-fragment fingerprints for over 300,000 bacterial aritificial chromosome (BAC) clones over a 17-month period. The mouse genome is similar in size to the human genome and follows the human as the only other mammal to have its genome completely mapped in this way. The entire map and associated data is made available as a public resource.
There are 305,768 clones present in the physical map, 289,506 of which are contained within the 7,582 contigs. This represents greater than 16-fold redundant coverage over an estimated 99% of the mouse genome.
The fingerprint map was constructed using a modified agarose gel methodology originally developed at Washington University Genome Sequencing Center (Marra et al., 1997), which was used previously to produce BAC-based physical maps of the Arabidopsis thaliana (Marra et al., 1999) and human (IHGSC, 2001) genomes. Two large-insert BAC libraries created by Pieter J. de Jong and Kazutoyo Osegawa (BAC/PAC Resources) were fingerprinted, RPCI-23 (female C57BL/6 mouse) and RPCI-24 (male C57BL/6 mouse). On a weekly basis, fingerprints were assembled into contigs using FPC software and made available for download.
The graph above shows the number of clones in the mouse map database as function of time.
The physical map contains 305,768, of which 289,505 are contained within the 7,582 contigs. This is estimated to represent a greater than 16-fold redundant coverage over 99% of the mouse genome. The locations of 13,969 genetic and sequence markers are also incorporated into the map and these data will assist in assigning chromosomal locations to contigs and for future positional cloning and comparative mapping experiments. Current efforts, both at the Genome Sequence Centre and Washington University Genome Sequencing Center, are now being directed towards refining clone order within contigs and joining contigs to eliminate gaps.
As more clones are added to the database, the size of contigs in the map grows and diminishes in number. The above plot shows the number of contigs with 2, 3-10, 11-20 and >20 clones as a function of time.
A major goal of the international Human Genome Project, which in 2001 saw the publication of the draft sequence of the human genome, is the mapping and sequencing of the mouse genome. The mouse represents the primary mammalian model for a wide array of medical research and the availability of a complete and high-quality physical map and genomic sequence will be crucial for the rapid progress of future genetic and biomolecular studies. It is anticipated that the mouse sequence will represent a critical tool for the interpretation of the human genome by indicating regions conserved between the genomes, both in protein coding sequences and in non-coding gene regulatory regions. (Additional information regarding mouse genome sequencing can be obtained from the Trans-NIH Mouse Initiative.)
A key role of the physical map is to facilitate the generation and assembly of mouse genomic sequence. An initial series of clones suitable for sequencing have been identified from the physical map by automated means and are scheduled for sequencing at Washington University Genome Sequencing Centre and The Whitehead Institute at MIT.
The Genome Sequence Centre has created an online, platform-independent application for viewing the physical map data. The entire FPC and associated data is also made available for download as a public resource
The Genome Sequence Centre plans to continue updating the map database with additional genomic data, as it becomes available. In addition, fingerprinting is currently underway to construct similar maps for both the rat and bovine genomes.
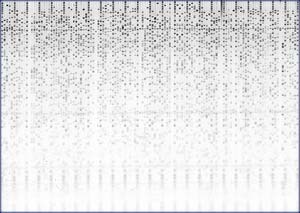
A typical finger print gel containing 121 lanes of DNA. Every 5th lane is a marker lane with 37 bands to calibrate the gel metric. Each of the 96 data lanes contains a digested BAC, with 30-60 bands.
| Data Summary | |
|---|---|
| Raw Data | |
| gel images | 3501 |
| data set size | 7.8 GB |
| physical map database (FPC) | |
| FPC database size | 1.9 GB |
| Genome coverage | >16x |
| Build time | 12 hrs |
| Clones | 305,768 |
| Contigs | 7,582 |
| Singletons | 16,263 |