Internet Contig Explorer version 3
Third release of internet map viewer
Vancouver, BC, Canada | The Genome Sequence Centre has been developing an online tool to view physical map data. The Internet Contig Explorer is a Java based tool that allows users to navigate through physical maps of various organisms and provides views and information on contigs, clones and markers.
iCE links
Download
|
Documentation
|
Support
iCE complements the functionality of FPC, by providing scientists with a read-only cross-platform dynamic viewer. The focus of iCE is to present the data in an intuitive and available manner, making it straightforward to poll the physical map for specific information about clones, markers and contigs. Users can search for and display individual clones, contigs, clone fingerprints, clone insert sizes and markers and can load into the software user-generated lists of clones and view their fingerprints. iCE is being used at our Genome Centre to offer up to the research community views of the mouse, rat, bovine, C. briggsae and several fungal genome BAC fingerprint maps we have generated or are constructing.
Fingerprint maps have proven useful in various applications, supporting both whole-genome and region-specific DNA sequencing as well as gene cloning studies. Fingerprint maps have been generated for several genomes, including those of Caenorhabditis elegans, human, mouse, Arabidopsis thaliana, rice and the nematode Caenorhabditis briggsae. Fingerprint maps of other genomes, including those of fungi, bacteria, the laboratory rat and the cow, are being generated. The increased interest in fingerprint maps has spawned a need in the research community for intuitive computer tools that facilitate viewing of the maps and the underlying fingerprint data.
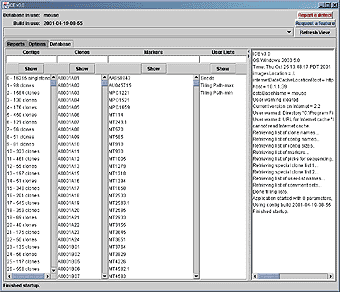
Figure: Main frame of iCE, showing the Database pane. The contigs, clones and markers for the current build are shown in the first three lists on the left-hand side. Arbitrary lists of clones, called user lists, are in the next list, with a log of application activity on the right-hand side of the frame. Options are available by choosing the Options tab. The top of the frame contains a drop-down list to change to a different contig display. Database queries can be made quicker by not retrieving gel images or markers, using the check-boxes. |
With an internet connection, iCE provides a way to download and locally cache current map data. With the newly implemented cache feature is best suited for slower intenet connections, in cases where downloading the latest data would be too time consuming, or for portability, where internet availability cannot be assured.
Anyone with an internet connection and Java-complient operating system can view and manipulate physical maps and associated data.
Original gel images, marker data and clone information is incorporated into the map view. Detailed clone information, such as the number and sizes of bands, is available and can be exported to a flat-text file for postprocessing.
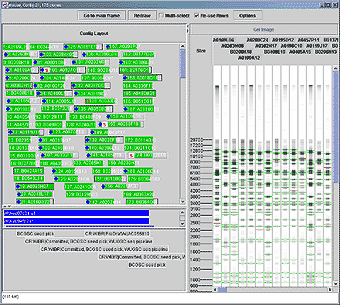
Figure The contig view. The layout of the clones within the contig is shown on the left, with colored boxes representing the left and right ends of the clone in the top area. Markers are shown in blue in the middle area, with the left and right ends indicating the left- and right-most ends of clones matching this marker. Remarks for the clones are show in the bottom area. The processed gel images for the clones are shown on the right-hand side of the display, with band locations indicated with horizontal lines. Green lines indicate bands confirmed by neighboring clones and red indicates unconfirmed bands. A ruler on the left side of the gel image area indicates the size of bands (shown here) or mobility depending on configuration. |
While browsing the map, detailed clone and marker information is available.
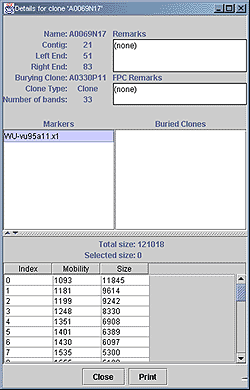
Figure. A detailed clone view. Here details of A0069N17 are shown. The contig and position within the contig, the burying clone, the clone type, number of bands and remarks are shown at the top. Any markers associated with this clone are listed, followed by the mobility and size of each band for the clone fingerprint. The total size of bands for this clone is displayed above the list of bands, along with the sum of sizes of selected bands, colored purple. |
iCE can be used as a tool to extract specific information about clones and markers. Below are shown the report screens which provide a means to export map data to text files.
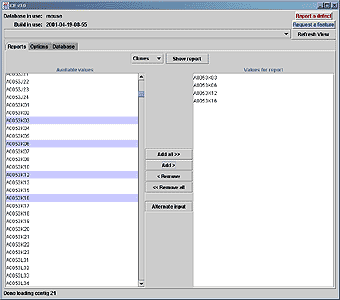
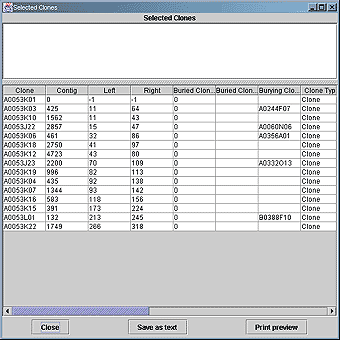
Figure. Selecting clones (above) for a report (below). |
