
Sockeye Screenshots
Version 1.1 - January 2004
This new release has enhanced tools for aligning sequences and working with regulatory elements.
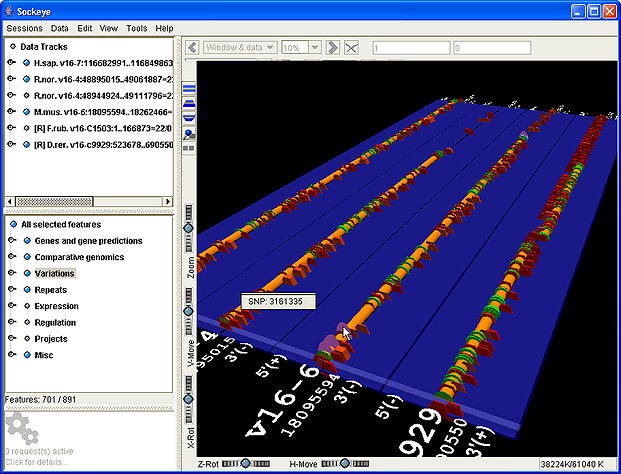
Four of six available EnsEMBL v19 CFTR orthologs. The human gene was queried by EnsEMBL ID; all other orthologs were queried with a single menu pick from this gene. After a quick visual inspection of the consistency of the gene structures in 3D, two of the six tracks were hidden, using the track list in the upper left. The remaining four will be operated on with tools for sequence alignment and regulatory elements. Cylinders are: exons (green), introns (orange), 5' and 3' UTRs (red and blue). Repeats are red hexagons; SNPs are mauve discs. All features are shown/hidden and queried-on-demand from the feature tree at the lower left; the 3D appearance of each feature type is user-configurable.
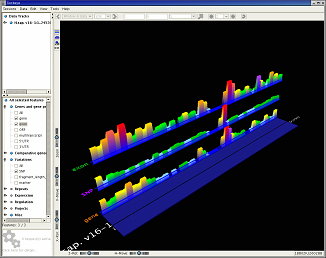
Semantically zoomed human chromosome 1 (245 Mb), showing density histograms of genes, exons and SNPs. The feature tree is open to show that exons and SNPs were requested; the default query returns only genes. Semantic zooming automatically switches between compressed and individual genomic features as a user zooms between large-scale and small-scale displays. Because large-scale queries are compressed, they deliver results rapidly into 3D.
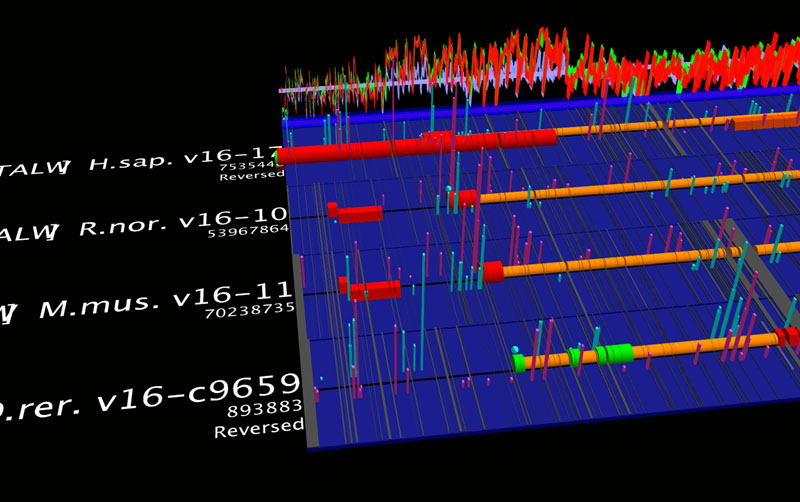
ClustalW sequence alignment for EnsEMBL p53 orthologues for human, mouse, rat and zebrafish, with PWM hits from a set of about ten TRANSFAC matrices. The matrices were drawn from a user-extensible library using a catalog browser. Alignment gaps are shown as dark bands. Vertical bars are PWM hits, with positive and negative strand hits offset and coloured differently. The graphs at the rear of the platform are sequence conservation profiles for two (red), three (green) and all four (blue) aligned sequences. Profiles are dynamically configurable. All operations were set up and returned results in genomic context. Sockeye's interactive 3D environment facilitates identifying certain conserved patterns of location and spacing of PWM hits relative to genes.
Detail of a sequence alignment for orthologous genes from C. elegans, C. briggsae and human.The 'ghost' in the 3D view shows the region displayed in the 2D viewer. Sequence conservation profiles are shown in both views. The red profile shows conservation between the two nematodes; the green includes the aligned human sequence. In the 2D view, alignment columns that correspond to conserved regions are shown by shaded blocks.
Detail of the above alignment, showing just the red conservation profile for the two nematodes. 'Conserved regions' (flat green blocks) correspond to regions of the profile that are above the current conservation threshold. Both profile and threshold are dynamically configurable.
Version 1.0 - November 2003
Sockeye on the cover of the November 2003 Linux Journal. The screenshot shows a BLASTX comparison of the SARS Tor2 coronavirus genome against known proteins of other similar viruses. The user-configurability of 3D features made it simple to change the default behaviour to height-scaled in order to show relative BLASTX similarities, and to colour-code proteins to show functional similarity.

Version 0.8.4 - May 2003
Combine external local calculations, GFF and Ensembl data
Conserved regions (GFF data, vertical bars) identified by mLAGAN in 100 Kb regions upstream of the 5' end of the human CFTR gene (Ensembl data, yellow cylinder in left image), and orthologous genes for a 'zoo' of species. Results for each species are shown as a set of bars on a pale blue baseline, with bar height proportional to the similarity score. Orange and yellow cylinders are genes, green cylinders are exons; red hexagons are repeats (user-editable). The CFTR gene is on the forward strand; the similarity results overlap a gene on the reverse strand (see chr.7: 115,450,000..115,800,000; the GFF-to-Ensembl alignment shown is arbitrary to within a few hundred bases). The right image shows a popup menu giving all GFF fields for a similarity bar (highlighted), and both relative and absolute coordinates.


Combine external public calculations, GFF and Ensembl data
Conserved regions between human, mouse and rat CFTR genes, from Vista alignments. Ensembl FASTA sequences for mouse, rat and fugu genes were aligned against the Human Nov. 2002 base genome at the GenomeVista server. Human coordinates for conserved regions with >70% similarity over 100 bp were returned. For mouse and rat, results were saved as flat files that were converted to GFF with a custom Perl script. No hits were returned for Fugu. To display the GFF results in Sockeye, Mm_Hs_ and Rn_Hs_similarity features, with corresponding baseline features, were added to user_config.xml, and the GFF data were imported and added to the CFTR Ensembl human track. Ensembl mouse and rat data were added with 'between-query' ranges set to centre the CFTR genes on the human gene. The similarity bar set closer to the human gene is rat-human; the farther set is mouse-human. Features are as in the above figures. As above, popup menus give detailed information on a 3D feature.


Wide dynamic range
The 19.5K genes on the six C. elegans chromosomes, queried directly from Ensembl v12 into a Sockeye running with 512 MB of Java RAM. The second and third images show a dynamic Java3D mouse zoom-in. Popup menus show summary information on a selected gene; other popup menus (not shown) offer Web links to detailed Ensembl or NCBI information.


- Genes with more than one transcript are marked by a floating-ball 'flag'. Passing the mouse over a flag pops up a label with the gene name and the number of transcripts (not shown).
- A right-click on a gene or exon pops up a menu that lists all transcripts for the gene and offers links to detailed Web information (left figure). Checking a transcript in the list persistently highlights its exon set.
- A right-click on a multitranscript flag pops up an initial implementation of a 2D display of all transcripts for the gene (right figure). The 2D display is consistent with the highlighted exon sets in the two figures.
The black line is the genome centreline; the forward strand is above and the reverse strand is below. The pale purple blocks are CpG islands. (Feature shapes and colours are user-editable.)
Version 0.8.0
|
|


