Gene Ontology (GO) Analyzer (v1.2) Primer
Table of contents
- Introduction
- What is GO?
- The Structure of GO terms
- Definition of Terminology
- Anatomy of the GO Analyzer
- Understanding scoring
- Scoring
with frequency values
- The functions and what they do
The GO Analyzer is a DiscoverySpace tool for investigating the qualities of biological records using GO terms (or "GO Analysis"). The Analyzer allows the user to characterize, possibly large, possibly disparate, sets of biological records by reference to associated Gene Ontology terms. Such biological records may be genes, proteins and any other record with a reference to the GO database. The GO Analyzer supports records from any biological database that provides links, directly or indirectly, to GO terms. Currently data sources such as Refseq, Locuslink, Swissprot and MGC are supported.
The analyzer is not designed for the detailed investigation of individual GO terms. Other tools such as Amigo (www.godatabase.org) will provide a better representation of specific terms. Instead the GO Analyzer will provide a macro, high-level, view to represent how sets of biological records (such as genes, proteins, etc) relate to GO terms. After finding the terms directly associated with a given set of biological records, the analyzer navigates the GO hierarchy to score terms based upon indirect, ancestral relationships. These ancestral associations allows the user to make deductions about commonalities within the set of biological records being analyzed.
This primer document is intended to introduce the user to the basic concepts of the Gene Ontology project. The user will become acquainted with the functionality made available by the GO Analyzer and will gain a detailed understanding of how data is represented in the analyzer view.
2. What is GO?
The GO (Gene Ontology) database does not itself house or define Gene product data:
GO defines a shared vocabulary of terms which are referenced and linked by other biological databases. By referencing GO, disparate biological records can be compared via their term associations. The GO database itself contains some references to records in other databases (eg. PFAM, INTERPRO, etc.) However the real power lies in other database entities referencing GO.
Of particular utility is the LocusLink database which heavily annotates its loci records using GO terminology. Locuslink links to and is linked by numerous other databases and thus by inference links those databases to GO. RefSeq, MGC and UNIGENE all reference GO terms via LocusLink. Other databases such as SWISSPROT can be linked to GO via other datasources such as the GOA (GO Annotation) project. The GO Analyzer uses such cross-references extensively to link a given biological record to associated GO terms.
At its core the GO Analyzer uses data from the Gene Ontology Consortium (www.geneontology.org). The GO website houses extensive documentation about the project and its processes.
3. The Structure of GO Terms
As noted previously, the GO Analyzer is not primarily designed to investigate individual GO terms but to describe how biological records relate to GO terminology. Therefore much of the structure of how terms interrelate has been abstracted away; when viewing potentially thousands of relationships at one time, properties of individual relationships become less important. Nonetheless, users of the GO Analyzer should have some grasp of how GO terminology is structured in order to have an accurate understanding of the data being represented. The GO database specifies a network of biological terms. According to the GO Consortium;
This property, that 'child' terms may have many 'parent' terms, is key to the power of the GO methodology: a term may be defined by reference to many other parent terms. However, this also means that the network of terms is difficult to visualize (unlike a standard tree graph). In addition, GO defines two kinds of parent-child relationship: 'is a' relationships and 'part of' relationships. Thus a term can be described by the fact that it 'is a' specialization and/or is a 'part of' other terms. In the macro view that the GO Analyzer offers, such 'is a' and 'part of' information is ignored.
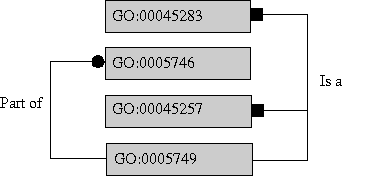
Figure 1) In the diagram above term 5749 has three parent terms; a 'part of' parent (5746) and two 'is a' parents (45283, 45257).
It is worth introducing the terms at the root of the GO hierarchy. The primogenitor, the root parent, of all GO terms is 'all' (all). All GO terms are 'part of' this term. The children of 'all' are 'biological_process' (8150), 'molecular_function' (3674) and 'cellular_component' (5575):
The purpose of this document is not to define the GO project. For a more thorough introduction to the GO structure please reference the GO consortium's 'Introduction to Gene Ontology' (http://www.geneontology.org/doc/GO.doc.html).
4. Definition of terminology
The relationships between GO terms are defined in terms of parents (more general terms) and children (more specialized terms). The analyzer makes use of the word ancestor to refer to all the parents of all the parents, recursively, of a given term. This concept of ancestor terms allows the analyzer to display ancestral commonalities between terms. The antonym of ancestor is descendant, which is used to describe the children of the children, recursively.
In order to use the GO Analyzer it is vital to understand two key definitions which are used widely throughout the application; direct association and ancestral association.
- A biological record is directly associated with a GO term if the record references the GO term, or if additional annotatation has been provided which links the two. A record may reference multiple GO terms. For example, REFSEQ 4502516 (carbonic anhydrase I) is directly associated with 5 GO terms.
- A biological record is ancestrally associated
with a GO
term if it has a direct association with the term or has a direct
association with descendant of the term. In
this way a record is ancestrally associated to all ancestors of the terms
it
is directly associated with.
For example,
REFSEQ 4502516 is directly associated with GO term 'cytoplasm' (5737).
The
parent term of 'cytoplasm' is 'intracellular' (5622). Therefore REFSEQ
4502516 is ancestally associated to 'intracellular' (via 'cytoplasm').

Figure 2) The diagram above provides an abstract visualization of how a biological record is associated to GO terms. Notice that the record is directly associated with terms by third party annotation (for example GOA). Additional ancestral associations are then determined by following the GO parental relationships.
5. Anatomy of the GO Analyzer
This section includes a group of images in order to orientate the new user with the GO Analyzer. Like most DiscoverySpace tools, the GO Analyzer is launched from the DiscoverySpace Databank. If a given set definition is of a datatype which has references to GO then the 'GO Analysis' button will be enabled.
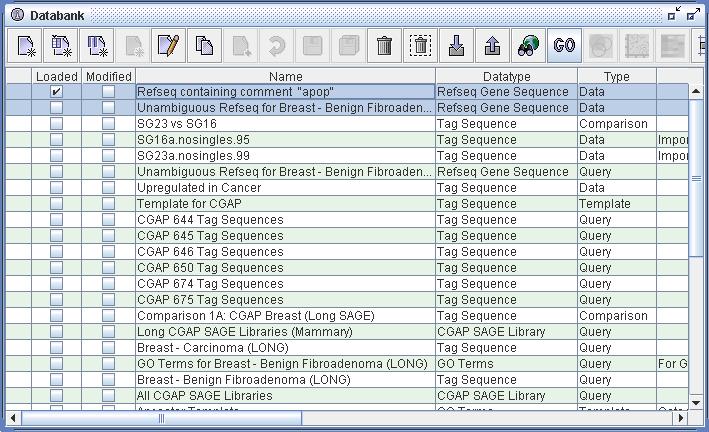
Figure 3) An image of Databank from within DiscoverySpace. One can see at the top of the table that two Data definitions of datatype 'Refseq Gene Sequences' have been selected. Because Refseq links to GO, the 'GO Analysis' button is enabled in the toolbar. Clicking this button will launch the GO Analyzer with these data sets.
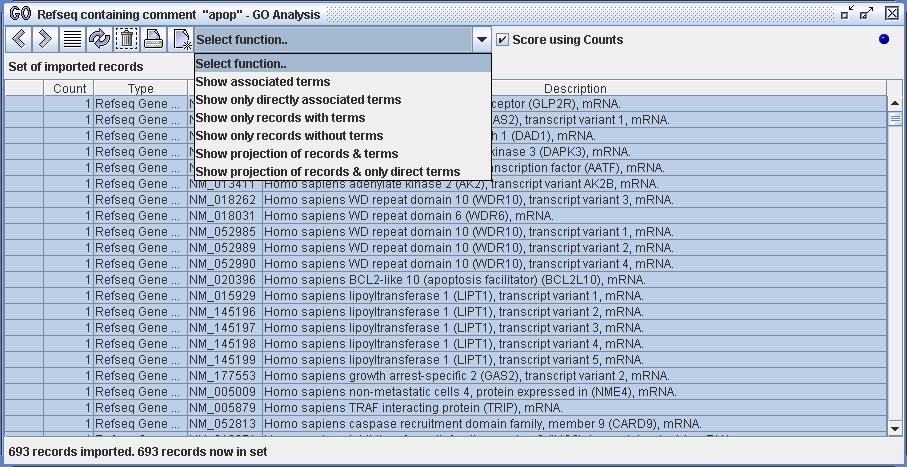
Figure 4) An image of the GO Analyzer. The user has selected the data from the Databank (the data definition 'Refseq containing comment "apop"') and has selected the action 'GO Analysis'. The analyzer has then loaded the Refseq records and imported them. The user has selected all of the Refseq records within the analyzer and is about to select one of the available functions.
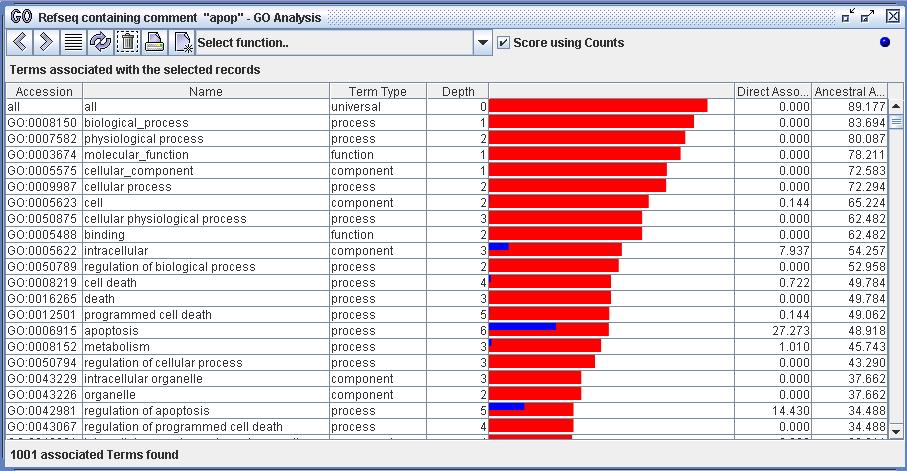
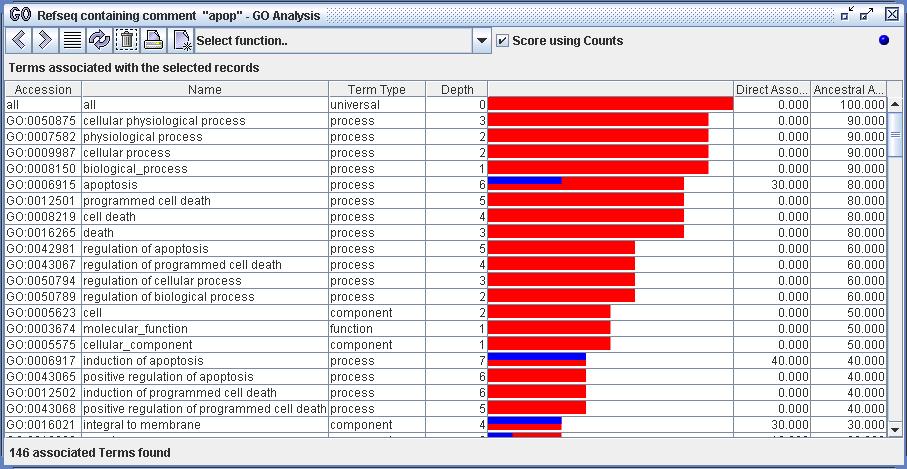
Figure 5) An image of the GO Analyzer. The view displays the set of terms associated with the selected records from figure 4. This was achieved by using the function 'Show associated terms'. The analyzer scores all the terms to represent the strength and quality of their associations with the set of selected records.
About backwards and forwards buttons
Like other browser-like interfaces (for example Internet Explorer, Netscape, etc), the GO Analyzer maintains a history of previous views within this analyzer session. The analyzer history is based upon the fact that each resulting view has a source view which preceded it; thus the progression of the browsing session can be analyzed. As each function is executed the existing source view is stored and the results of the function are displayed in a new resulting view. If the user wishes to backtrack to a source view she may do so via the backwards button. She will be able to return to the resulting view via the forwards button.
If a function is executed from a previous view then a new result view will be created from the previous view. The existing result view will replace the previous one. For example, executing a function on view A produces view B. Going back to view A and executing a new function on it produces view C. View B is then not recoverable via the backwards or the forwards buttons.
The controls of the toolbar

Figure 6) A detail from the toolbar of the GO Analyzer. From left to right: the Backwards button, the Forwards button, the Select All button, the Toggle Selection button, the Remove Selection button, the Print image to file button, the New analyzer button and the Select function list box. The user executes functions by making her selection from the available records or terms and then selecting an available function from this list box. On the right hand side of the function box is a check box which affects the scoring more of the analyzer (see 'Scoring with frequency values' below).
The Backwards button
The backwards button returns the user to the source view of the the current view, unless there was no previous view.
The Forwards button
The counterpart to the backwards button. If the user has used the backwards button to review previous information then she may wish to return to subsequent resulting views. The forwards button returns the user to the result view subsequent to the current view, unless there was no subsequent view.
The Select All button
Functions are executed on the selection of rows from the current view. It is often the case that the user will wish to select all records in the current view. Use the Select All button for this purpose.
The Toggle Selection button
This button deselects all of the currently selected rows and selects all deselected ones. If no rows are selected then all rows will be selected and if all are selected then all will be deselected.
The Remove Selected button
All selected rows are removed from the current view. This is done by creating a new view with only the retained records. Thus the original set of rows is still available via the backwards button.
The Print image to file button
This saves a JPEG copy of the current view to file. This will include all of the view and not just the portion viewable via the scrollbar.
The New analyzer button
Creates an exact copy of the current analyzer, including all previous and subsequent views.
The Select Function list box
Functions execute on the selection from the current view. The available functions are dependent on the type of the current view; terms or biological records. A new view is created to display the results of the function. Thus the previous, source view is always available via the backwards button.
Functions are explained in detail in section 8; The functions and what they do
.
6. Understanding scoring
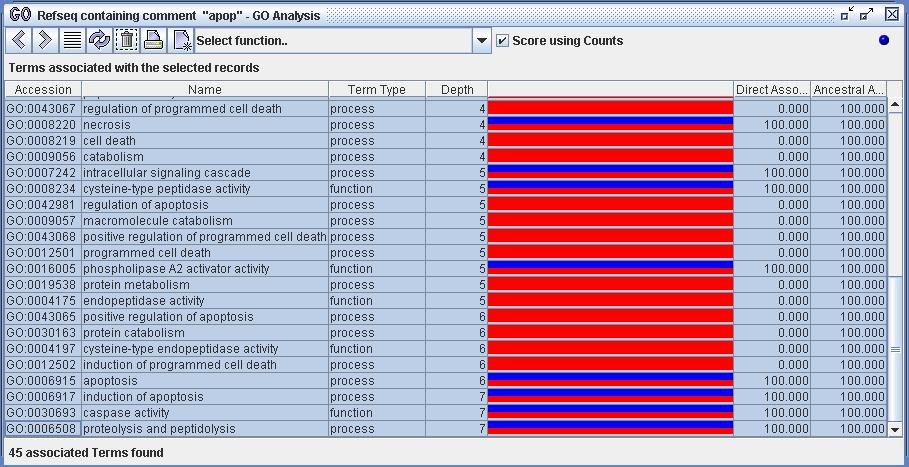
When displaying potentially thousands of GO terms related with a given set of biological records it is vital that there be some concept of 'more related' in order to sort the GO terms by relevance. To do this the the analyzer scores the set against the last selected set of records. The analyzer scores each term by how it is directly associated with the set of records and how it is ancestrally related to them. Thus each term is displayed with two scores: Direct Associations(%) and Ancestral Associations(%). These values are also represented in a bar graph; the blue bar is for direct associations and the red bar for ancestral associations. Notice that because direct associations are a subset of ancestral associations the blue bar overlays the red bar.

Figure 7) In the image above one can see that the term 'apoptosis' is directly associated to 27% of the selected records and is ancestrally associated with 48% of them. The term 'organelle' has no direct associations but is ancestrally associated with 37% of the set.
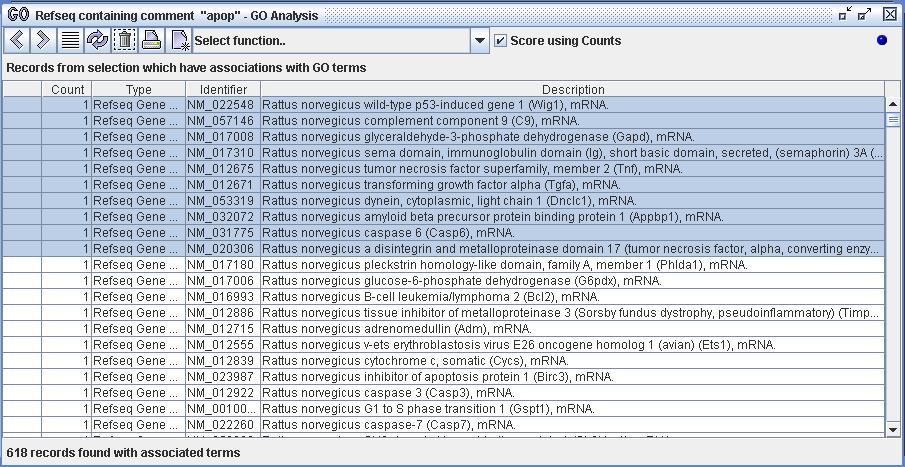
Figure 8a) The user has isolated a set of 618 Refseq records within DiscoverySpace and has imported them into the GO Analyzer. The user has then selected the first 10 records displayed within that set for further analysis. The user can now choose and execute a function upon the selected set of Refseq records.
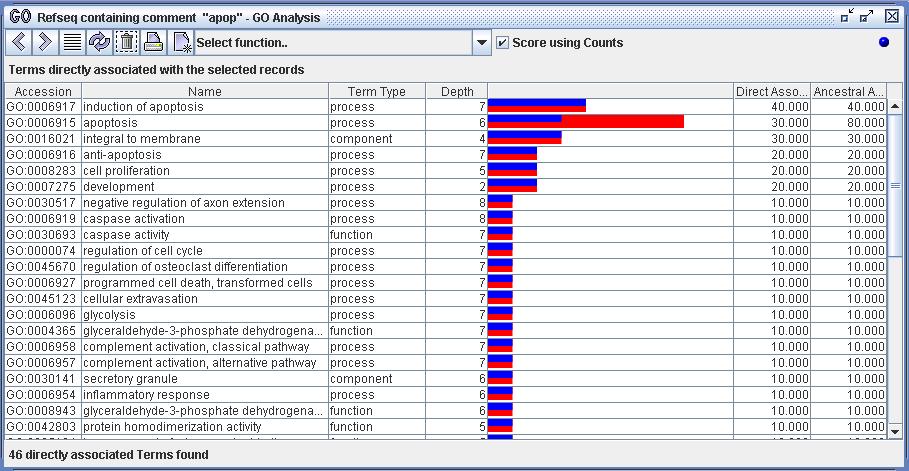
Figure 8b) The function 'Show only directly associated terms' has been executed on the 10 selected Refseq records from figure 8a. All terms that are directly associated with the selected records are displayed. Each term is scored by the percentage of the selected record set that have direct associations to that term. This percentage is indicated by the blue bar. For example, the top row indicates that 40% of the selection is directly associated with the term 'induction of apoptosis'. Notice that the term 'apoptosis' has ancestoral associations (80%) with the Refseq set in addition to its direct associations (30%). This is indicated by the red bar.
7. Scoring with frequency values
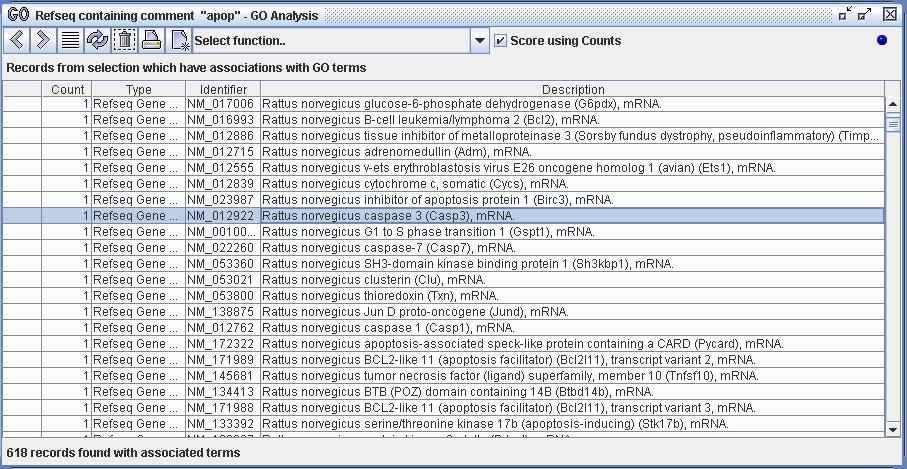
The DiscoverySpace application is built around the concept of a multiset, where a multiset is a set which can hold duplicate entries. This multiset functionality is used within DiscoverySpace to represent gene expression; the 'Count' of the number of copies of a gene in a set represents its expression. This value can be used for the scoring of Terms within the GO Analyzer to add weight to a term based upon the Count of its related records. When records are imported into the GO Analyzer, the counts, if available, are imported as well. The Analyzer operates in two scoring modes; one which include the count value and one which does not. The screenshots below attempt to make this functionality clear.
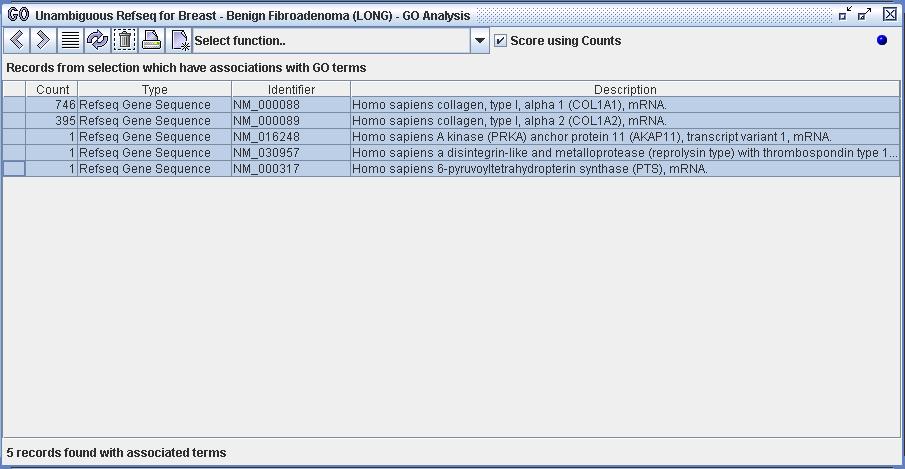
Figure 10a) The user has isolated a set of 5 Refseq records within DiscoverySpace and has imported them into the GO Analyzer. These 5 records have frequency values as can be seen in the 'Count' column. In previous screenshots all records have had a count of 1. The counts of the first two records massively outweighs the counts of the last three. For example, one can see that NM_000088 has a count of 746, while NM_000317 has a count of 1.
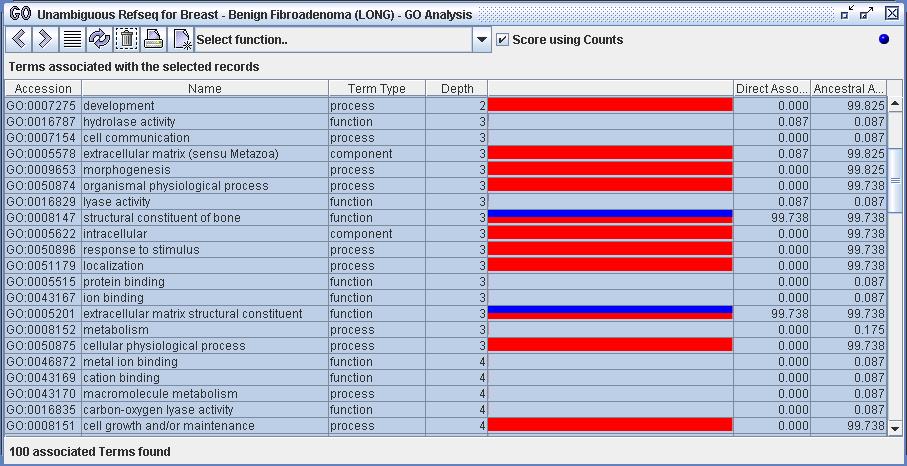
Figure 10b) The function 'Show associated terms' has been executed on the 5 selected Refseq records from figure 10a. Notice that the "Score using Counts" box is checked. The term 'intracellular' is associated with 99.738% of the record set. This term is associated with the two most expressed genes. By constrast, the term 'metabolism' is associated with only 0.175% of the record set; it is associated with two of the less expressed genes.
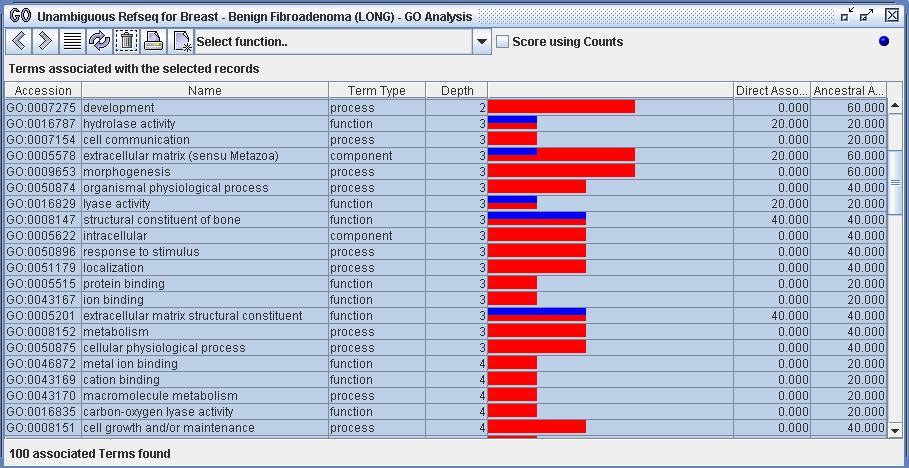
All views of GO terms will be ordered by strength of ancestral association, unless otherwise noted. All terms are scored by the last selected set of biological records:
Record Functions
Show associated terms
Displays the terms ancestrally associated with the currently selected records.
Show only directly associated terms
Displays only the terms directly associated with the the currently selected records.
Show only records with terms
Displays only those records which have associations with GO terms. This allows the user to quickly exclude unmapped records.
Show only records without terms
Displays only those records which do not have associations with GO terms. This allows the user to quickly identify unmapped records.
Show projection of records & terms
Displays each of the biological records projected by each of the GO terms with which it is ancestrally associated.
Show projection of records & only direct terms
Displays each of the biological records projected by each of the GO terms with which is is directly associated.
Term Functions
Show records with associations
Displays only those records, from the last selected set of records, that have ancestral associations with the current selection of GO terms.
Show records with direct associations
Displays only those records, from the last selected set of records, that have direct associations to the current selection of GO terms.
Show parent terms
Displays all parent terms of the selected GO terms. Both 'is a' and 'part of' parents are returned.
Show ancestor terms (excluding selection)
Displays all ancestor terms of the selected GO terms. Excludes the currently selected terms (unless they themselves are ancestors).
Show ancestor terms (including selection)
Displays all ancestor terms of the selected GO terms. Includes the currently selected terms.
Show child terms with ancestral associations
Displays those child terms, of the current GO selection, that are ancestrally associated with the last selected set of records.
Show all child terms including unassociated
Displays all child terms of the current GO term selection, regardless of whether they have relationships to last selected set of records. This function may take some time as it potentially has to requery the database to load child terms without relationships.
Show records without associations
Displays only those records, from the last selected set of records, that are NOT associated with the current selection of GO terms.
Show records without direct associations
Displays only those records, from the last selected set of records, that are NOT directly associated with the current selection of GO terms.
N.R. ROBERTSON 4 APR 2005 (Revision 1.2)
