SAGE Analysis Primer for DiscoverySpace 4
DiscoverySpace 4 has overhauled SAGE analysis. Please read the primer about Queries to gain a better understanding of this major feature
Definition of Terms
|
| Perhaps the most difficult
change in the SAGE functionality of DS4 is the reconceptualization of
the data model. Whereas in DS3 the user would define new "SAGE
Libraries" from libraries in the database, in DS4 one defines "Sets of
Tag Sequences". |
Step by step screenshots
|
| This section contains
illustrations and explanations of the main SAGE use cases. |
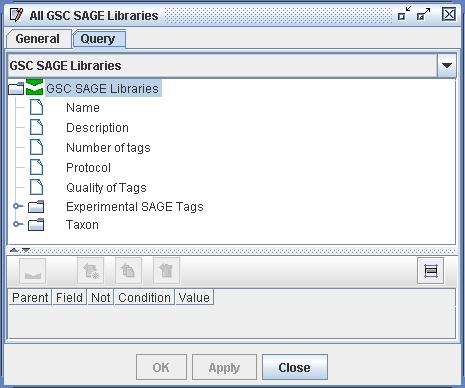 |
| Figure
1) A screenshot of a Query definition. In this query the user is
asking "Show all GSC SAGE Libraries available to me". Each user is
automatically constrained to a subset of the total available libraries
and tags as determined by the database administrator. To create the
query pictured above the user has selected the origin class "GSC SAGE
Libraries" and has attached no filters. She has also given the
definition the name "All GSC SAGE Libraries". |
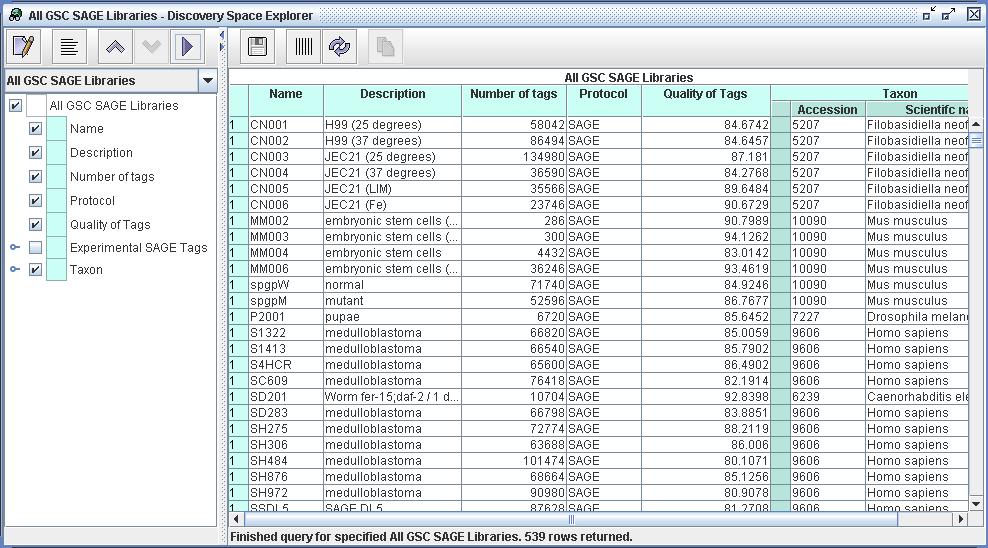 |
| Figure
2) A screenshot of the Explorer from DiscoverySpace 4. This shows the
set of resources defined by Query "All GSC SAGE Libraries"
(as defined in Figure 1). The user has selected multiple properties
from these resources, including Description, Protocol and Taxon. Now
that she can view all available libraries the user can now construct
queries to define particular sets of Tag Sequences from those libraries. |
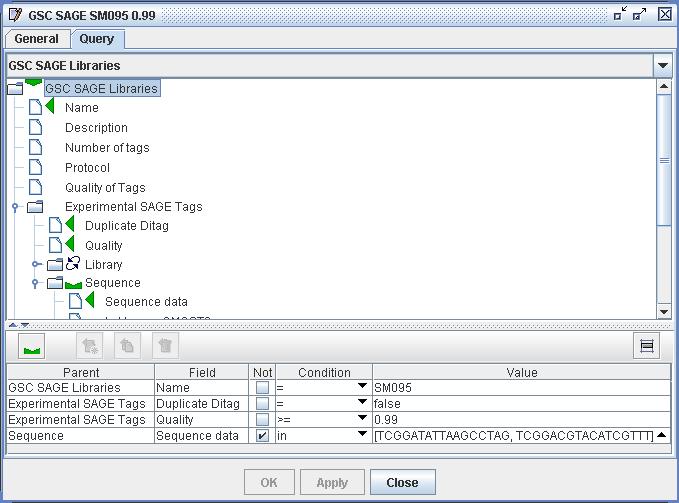 |
| Figure
3) A screenshot of the Query Set Definition from DS4. This query
specifies a certain set of Tag Sequences from library SM095. Within
this definition the user has created a query path from the start class
"GSC SAGE Libraries" through to "Experimental SAGE Tags" through to the
"Sequence"s of those experimental tags. She has set "Sequence" as the
end of the query, which will therefore result in a set of Tag
Sequences. The user has then constrained the query path to use only the
library named "SM095", only the SAGE Tags with a quality of over 0.99
which are not marked as duplicate ditags, and only the sequences
without sequence data "TCGGACGTACATCGTTT" and "TCGGATATTAAGCCTAG". This
final constraint is to exclude linker sequences used by the Long SAGE
protocol. Once such a Query is constructed the user the query can
be duplicated and the duplicate edited - this is currently the best way
to reuse Query definitions in DS4. |
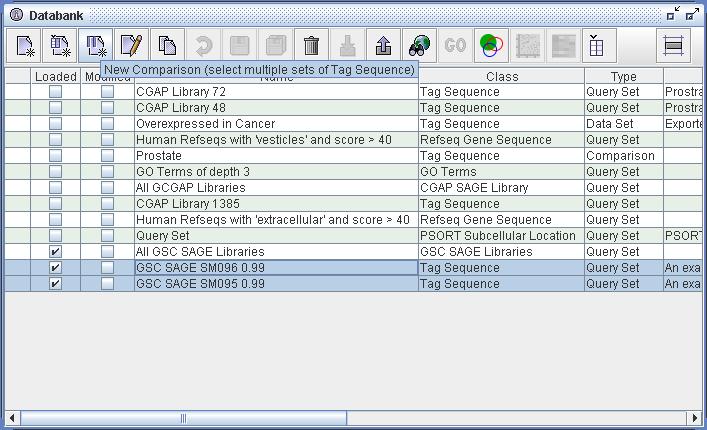 |
| Figure
4) A screenshot of the Databank. In this image one can see that the
user has constructed two sets of Tag Sequence resources (highlighted).
One of these, "GSC SAGE SM095 0.99", has been constructed as
illustrated in Figure 3). The other, "GSC SAGE SM096 0.99", has been
created by duplicating the SM095 query and then altering the "Library
name" value of the query (to SM096). The user has also renamed this new
query. The best way of reusing queries is to duplicate and edit the
result. In the figure above one can see that the user has selected both
of these new Query definitions. With these two sets of Tag
Sequences selected one can see that the "New Comparison" action (third
from left) is enabled. The result of selecting this action is shown in
Figure 5) below. Also note that the Venn Table action is also enabled
(fifth from right). The result of selecting this action is show in
Figure 6) below. |
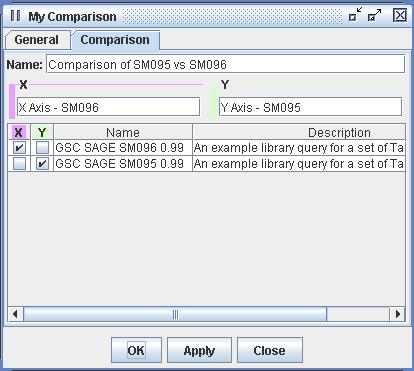 |
| Figure 5) A screenshot of the
Comparison Definition. In this figure one can see the result of the
operation pictured in figure 4). The user selected SM095 and SM096 and
selected "New Comparison". Be aware that one can construct a Comparison
with two or more sets of Tag Sequences. The user has given a title to
this new Comparison, has labeled the axes and has chosen which sets of
Tag Sequences are to be represented on which axes. In this case SM096
is attached to the x-axis and SM095 is attached to the y-axis. Once a
Comparison has been constructed it can be selected in the Databank and
viewed in the Scatter Plot by selecting the Scatter Plot action. |
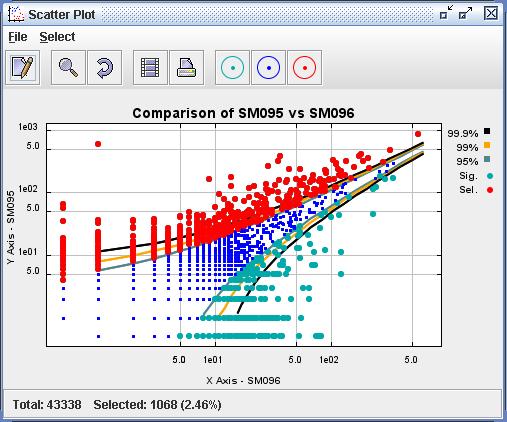 |
| Figure
6) A screenshot of the Scatter Plot. This is the result of viewing the
Comparison constructed in Figure 5) in the Scatter Plot viewer. The
user
has used the Select menu to select all upregulated datapoints. These
datapoints can now be dragged, as Tag Sequences, into the Databank and
into their own Data definition. |
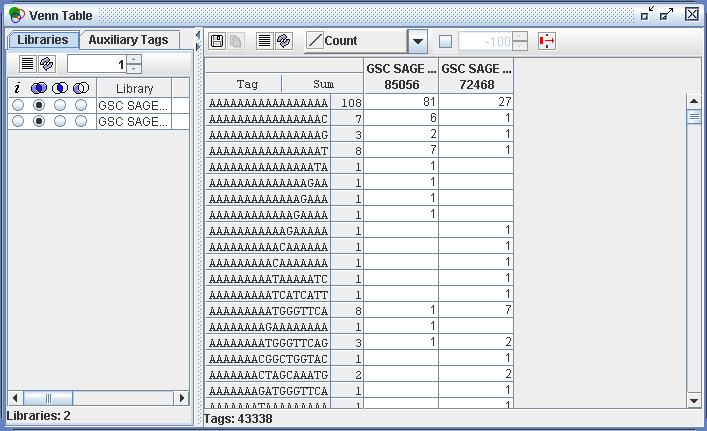 |
| Figure
7) A screenshot of the Venn Table. This is the result of viewing the
selected sets of Tag Sequences from Figure 4) in the Venn Table tool. |
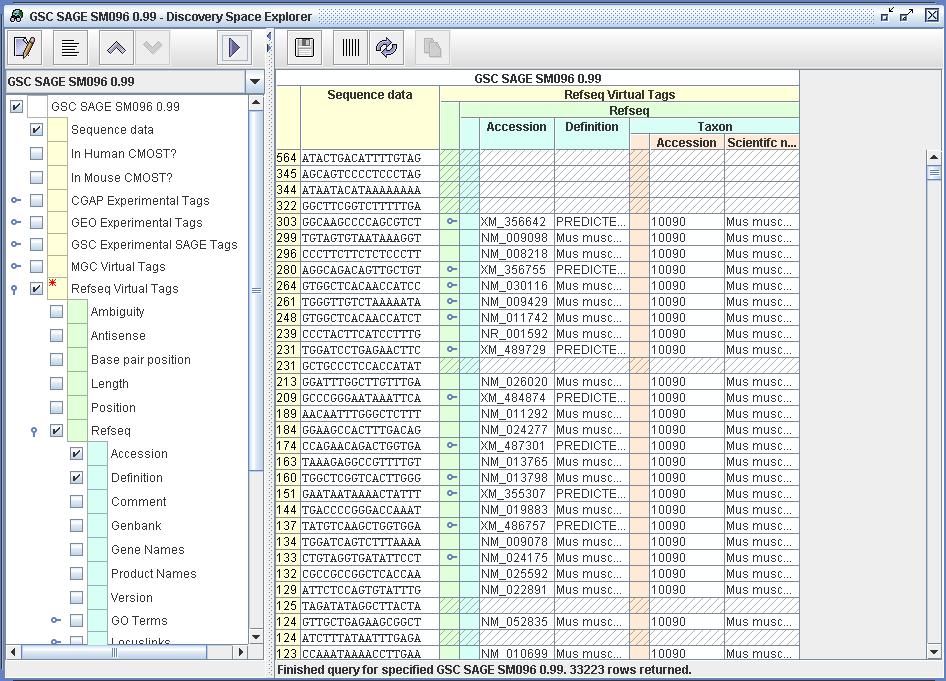 |
| Figure
8) A screenshot of the Explorer. This image shows the selected Tag
Sequences from SM096 viewed within the DiscoverySpace Explorer. The Tag
Sequences have been mapped to Refseq Virtual Tags (Mouse only) and then
to their source Refseq resources. Thus for each SAGE Tag Sequence one
can see the relevant Refseq Gene. |
N. R. ROBERTSON 05 APR 2005
Page last modified
Jun 08, 2010
